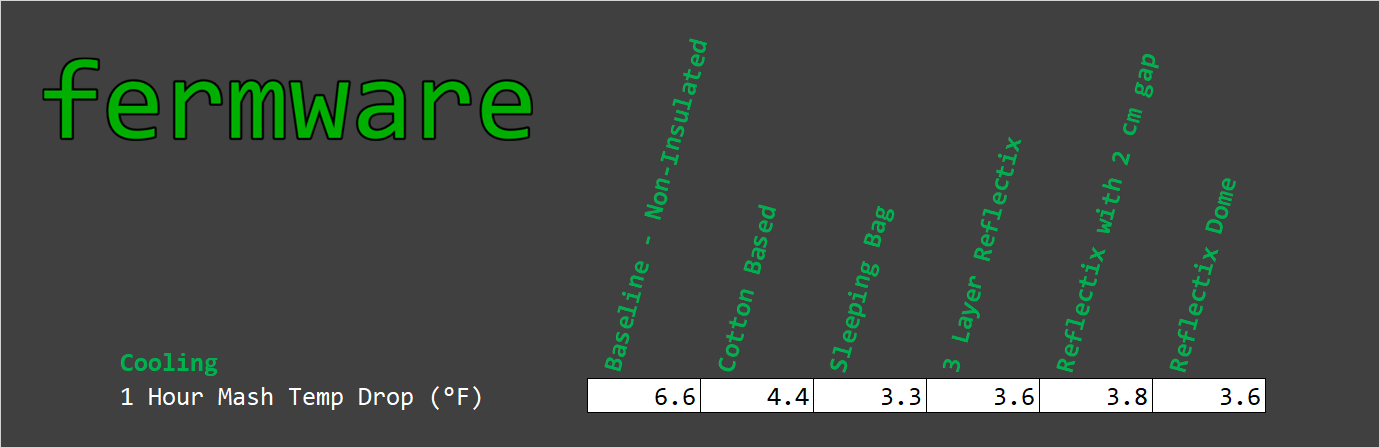
Category Archives: Charts & Graphs

Fermentation Controller Temperature Probe Placement

Once one has decided to install a temperature controller on their fermentation chamber, one of the first questions is where to place the temperature sensor. In this post, I’ll show the results of 3 identical beers fermented using 3 different configurations.

Nerd Alert!

Warning, the material in this post could get a bit nerdy.

WarningSign

Difficulty: level_2

If you have made it this far, please continue.

Time Required

Just the time to read this article and implement your chosen solution.

Affiliate Links

Background

A recurring question I see on various social platforms is “where do I place the temperature probe? I often see a variety of answers, with each person claiming to be right or saying it doesn’t matter. Typically the choices for probe placement are:

  • Thermowell / directly in the fermenting beer
  • Taped or placed on the side of the fermenter
  • Placed in or on some sort of buffer (bottle of water, can of domestic beer, etc)
  • Hanging in the fermentation chamber

I have seen other tests where a temperature probe is just used to control the temperature of a mass of water. This is good information, but it only tells part of the story.

The reality of the situation is that while fermenting, from the fermenter’s reference frame, it is an exothermic reaction. What this means is that while fermentation is active, the direction of heat flow will be from the beer, through the fermenter wall, to the air in the chamber, then out of the chamber to atmospheric. This is of course assuming your fermentation chamber is placed inside or in a location that is warmer than the desired fermentation temperature. If your fermentation chamber is in a garage or location that will be colder than the desired fermentation temperature and any situation where you’ll be pushing your fermentation temperature above ambient, the direction of flow will be different. That will be discussed later in the post.

From basic controls theory, one should measure directly what one is trying to control. In this case, if you are trying to control the temperature of the fermenting beer, you should then measure the use the temperature of the fermenting beer as the input to your control system.

Interchangeable words in THIS post

probe = temperature sensor used to drive control algorithm
temperature probe = temperature sensor
fermenting beer = fermenting wort = beer = wort
fermenter = carboy = bucket = fermentation vessel
fermenter != fermentation chamber
fermentation chamber = refrigerator = keezer = kegerator

If you enjoy this post, please consider supporting this site by clicking on and purchasing products through the affiliate links in this post and on this website.

Cost / Tools / Materials Required

It depends on your decision after reading this article

Setup and Method

The Subject / Constant

Three different fermentation chambers were used, all of which used the exact same wort, with the exact same yeast. The recipe was an Oktoberfest with an OG of 1.054 and the yeast was a slurry of Wyeast 2206 from a previous batch. Each wort started with a temperature around 65 degF so that one could assess the performance of each control method in rapidly cooling wort. My target fermentation temperature of the beer was 52 degF and this was done in my garage in September in Indiana.

The Controller

The fermentation controller was based on the BrewPiLess, which is a derivative of the BrewPi controller. I like this setup, because it doesn’t require both a Raspberry Pi and an Arduino. All it requires for the controller (as of now) is a much less expensive ESP8266 / ESP-12E or a Wemos D1, plus the temperature sensors and whatever power relay you want to use. It can be used as a “dual-stage” controller, meaning that it will control a heating and cooling device for your fermentation chamber.


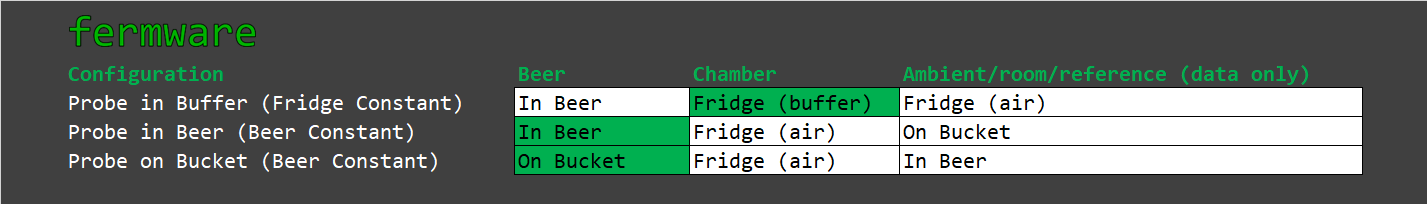
The standard BrewPiLess setup allows for 3 temperature sensors.  I have my controllers set up to use all 3.  The standard sensors would be:

  1. Beer Temp
  2. Chamber Temp / Fridge Temp
  3. Room Temp

I put the 3 sensors to best use to measure the fermentation chamber characteristics.  I also checked each set of sensors prior to installing in the fermentation chambers and each controller’s temperature sensors were within 0.5 degF.

With the BrewPi/BrewPiLess setup, there are a few different control options. You basically set your desired temperature and then determine what sensor in the setup will be used to maintain this temperature.

Beer constant

The fermentation chamber will be cycled so that the target temperature of the chamber will be driven by the sensor labeled “beer”.  This is the control method I used for all 3 configurations.

Fridge constant

The fermentation chamber will be cycled so that the target temperature of the chamber will be driven by the sensor labeled “chamber”.  I did not use this control method at all.  I would only recommend this method for a kegerator/keezer.

The Variables

Fermentation chambers

With all 3 fermenation chambers using the BrewPiLess controller and the same wort, I tried to minimize the variability of each setup. The biggest difference in all three setups is that identical fermentation chambers were not used, which in my opinion is a negligible factor. My opinion is founded by considering the speed with which the fermentation chamber may adjust it’s temperature with respect to the rate of change in temperature of the fermenting wort. The fermentation chambers / refrigerators, can change temperature rapidly and effectively with respect to the rate of change of the fermenting beer.

Control Methods

The great thing about the BrewPiLess setup, is that you can log data locally, or in my case, log the temperature data to a cloud based service. In my setup, I logged to Thingspeak.com. I logged every minute during the test, which was required to pick up on temperature changes and responses during each power cycle of the refrigerator. For normal fermentations, I log every 10 minutes.  This data would then be used to compare target temperatures to the actual temperature of the fermenting beer. The table below summarizes the various control methods and probe placement that were used in the three fermentation chambers.

I’ve tried to color code the pictures of the setups similar to the results charts shown later.

Yellow = Beer temperature probe

Blue = Fermentation chamber temperature

Orange Dotted = Control temperature probe

Probe in Buffer (Fridge Constant)

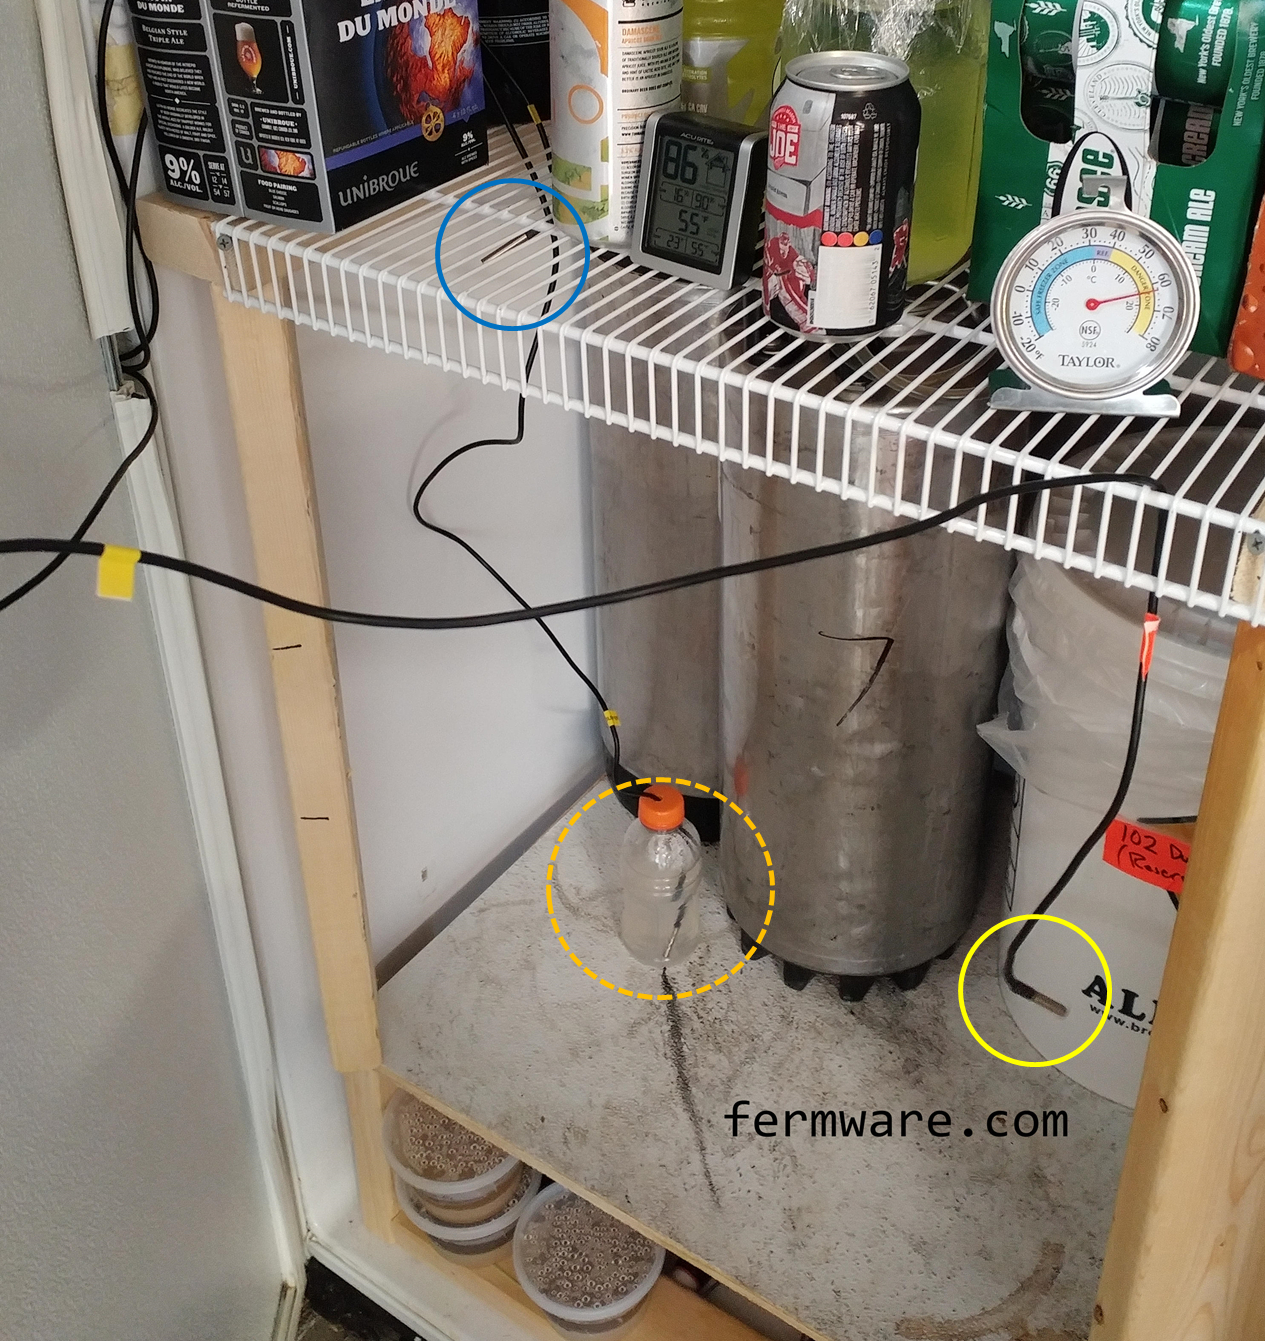
This setup is what we call at our house, the “Lagering Fridge”.  The construction was highlighted in my series of posts Refrigerator Conversion to Kegerator

Below is a picture of the temperature probe in a buffer.  It’s simply a small volume of fluid that will serve to dampen or “buffer” the temperature swings.

Probe in Beer (Beer Constant)

This is the theoretical best method as the temperature controller is controlling to the actual beer temp.  This is in a converted dorm fridge I use as a lagering chamber.  I placed the temperature probe midway back in the fridge so that it’s between the cooling element and the door.


Here is a top view diagram of where the sensors were positioned in the last 2 configurations.

Probe on Bucket (Beer Constant)

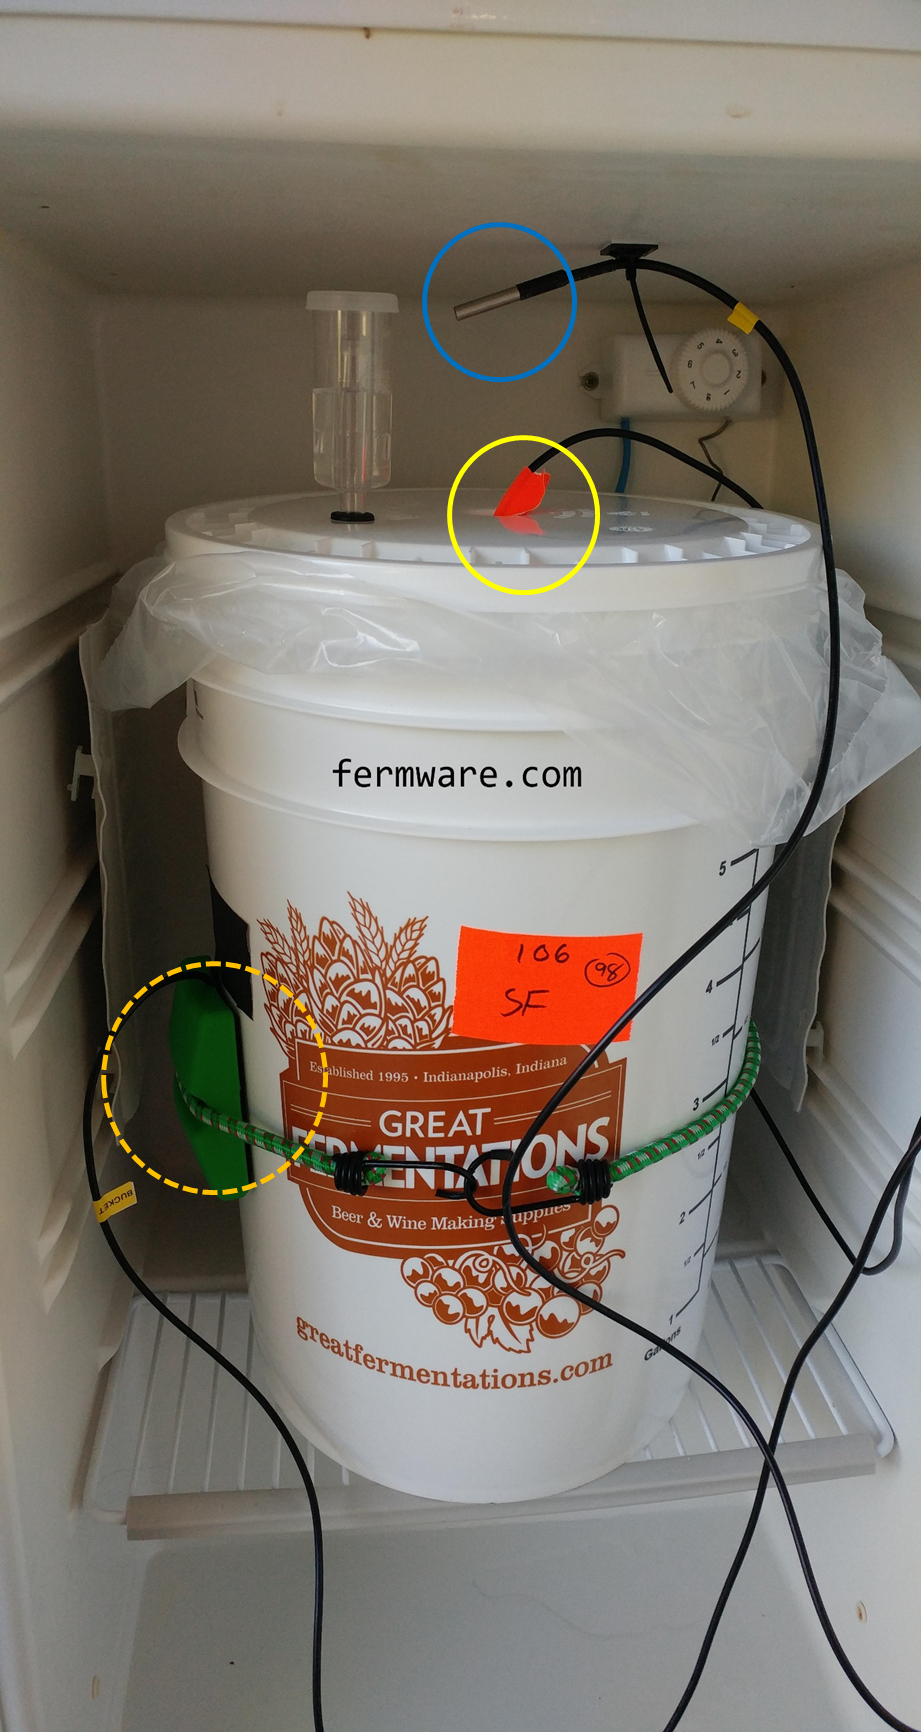
This is basically the same setup as Probe in Beer, but in a different fridge (same size fridge) and obviously a different control method.  This method in use is the easiest in terms of not having to do much extra to set up, since you are simply placing the temperature probe on the outside of the fermenter.

Results

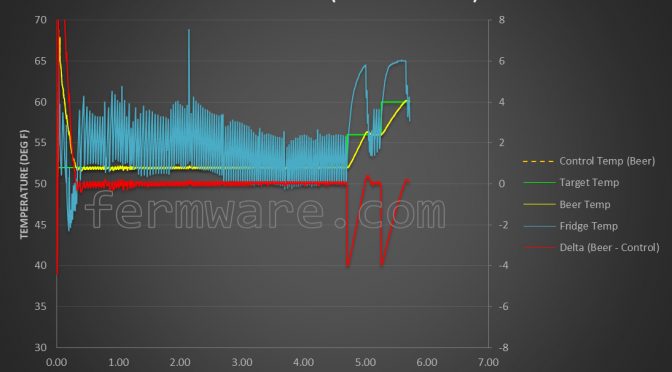
Fortunately, each of the three methods provided distinctly different responses, which enabled me to show that there are differences in how accurately each method controls the temperature of a fermenting beer. I’ll start with what I would consider the poorest control method. I would like to point out that once I started the diacytl (temperature ramp up)rest period, all of the methods showed a larger negative (-4 to -7 degF) delta due to the fact that there was not a forced warm up of the wort, but rather a passive warm up due to internal fermentation heat and ambient heat outside of the fermentation chamber.

Probe in Buffer (Fridge Constant)

Using this method, the fridge and beer temp are measured in addition to the control temp, which was the buffer. You can see in the chart a bit of wonkyness at the beginning, where in my attempt to be clever, I mislabeled the sensors and had them in the wrong locations. I fixed it within a few hours and it did not affect my interpretation of the final results.

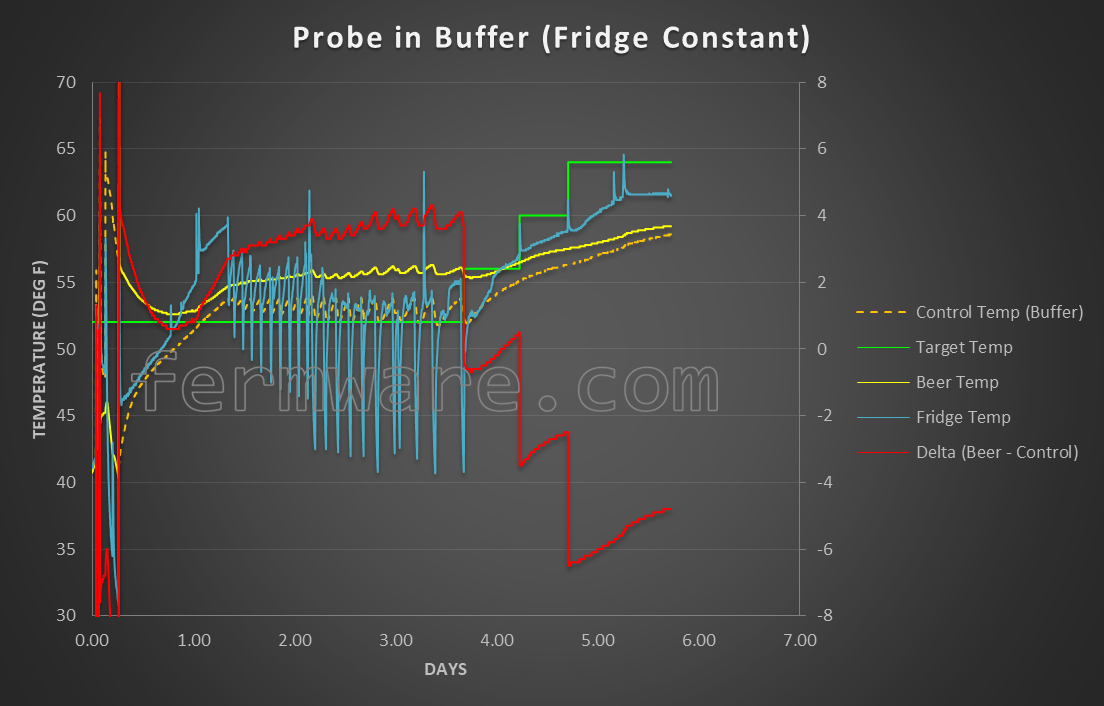
During the chilling phase, this method shows that it takes nearly 15 hours for the wort to chill from 65 degF to below 53 degF. This would be explained by the fact that the buffer was less than 16 oz of starsan water versus 5 gallons of wort and it reached the setpoint temperature much sooner than the the uncontrolled fermentation bucket would.

Once the wort had chilled down to temperature, this method still showed having trouble keeping the fermenting beer at the target temperature. The fermenting beer was about 3-4 degF warmer than the setpoint through the intitial portion of fermentation.

Probe in Beer (Beer Constant)

For the chill down phase, it took 6.8 hours for the wort temp to go from 65 degF to below 53 degF using this control method. Barely slower than the probe on bucket method, so we could potentially call this within capability of the refrigerator. I could do the math on the amount of energy or heat pulled from the air inside the fridge, but I’m not going to nerd out that much.

For the remainder of the initial fermentation period, the temperature of the beer was dead on target. From looking at the data, the moving peak-to-peak temperature swing of the refrigerator was much larger using this control method than the probe on bucket control method.

Probe on Bucket (Beer Constant)

The overall result here is not what I would have expected. I would have assumed that the actual fermenting beer temperature would have been warmer than the target temperature (controlled by the outside of the fermenter), but what the data showed is that it was the complete opposite, however small (within 1 degF).

It did take 6.5 hours for the wort temp to go from 65 degF to below 53 degF using this control method. At first the temperature controller overshot and took the wort to 2 degF below the setpoint, then seemed to settle in around 1 degF or less lower than the setpoint for the remainder of the initial fermentation period.

Discussion

Having looked at the actual data, here are my opinions on the pros/cons of each method

Probe in Buffer (Fridge Constant)

Pros: nothing to attach to your fermentation vessel
Cons: least accurate method

Probe in Beer (Beer Constant)

Pros: most accurate method
Cons: highest risk of infection of the 3 methods

Probe on Bucket (Beer Constant)

Pros: not much extra equipment/setup for this method and less risk for infection
Cons: middle of the road on accuracy

Astute readers will notice that in the Probe in Beer and Probe on Bucket configurations, the Fridge Temperature was above that of the beer.  This does not make sense, right?  One has to understand that the “Fridge” temp sensor was only reporting what that sensor was reading and not necessarily the actual temperature of the fridge.  It’s entirely possible that at the top of the fridge where the sensor was mounted, it could have been warmer than the rest of the fridge, presumably due to heat ingress to the refrigeration chamber.

I’m not about to launch another blog post about fermentation chamber thermodynamics.  I could, but I don’t think it will serve a majority of the homebrew community.

Fermentation target above ambient

If you are in the case where you need to raise the temperature of the fermentation above ambient, I would propose that the method of attaching the probe to the outside of the fermenter would probably still be sufficient. However, you should be careful to insulate the temperature probe from the heat source. If you are using a heat wrap, definitely don’t place the probe right on the heat wrap, as the controller will most likely cycle on and off fairly often and either fail prematurely or not get to the desired fermentation temperature.

If you decide that attaching a temperature probe to the side of your fermenter is impractical, I recommend placing the probe in a location that will not be in the direct path of the cold air from a fan, cooling source or right next to the door.

If you decide that attaching the probe to the outside of the fermenter is ideal, I would recommend placing the probe midway up the fermenter so as to be in the middle of the liquid level. As in the above recommendation, I would place the probe on the fermenter midway between the door of the chamber and the cooling source. That way you at least are splitting the difference between the warmest and coolest regions of your chamber. If you have a circulation fan, I would also recommend placing the temperature probe out of the airflow.

Finally above all else, I would try to place some sort of insulation on the outside of the probe, so that the probe is receiving most of it’s measurement from the heat exiting the fermenter walls. Suggested ideas in varying levels of effectiveness would be a towel, bubble wrap, actual insulation, tape, etc.

If your chosen approach is a thermowell or placing the probe directly in the fermenting beer, there are many options out there. I would just be sure to make sure you have a good seal where the probe cable enters the fermenter. If not, you’ll have a nice place for unwanted bugs to make their way in.

Conclusion

As shown, the most accurate method is to place the temperature probe in the fermenting beer. However it is up to the reader to determine what suits them better.

I personally have taken the stance that putting a probe into the fermenting beer is one more possible source of infection and yet another thing that I have to clean. I will accept the few degrees difference between target and actual and make judgement calls with each batch on how aggressive I want to be on the over/under on my setpoint from target.

I also take the approach that if your target was 50 degF and your fermenting beer remains at 48 or 52 degF, I do not think the end product will be affected enough to make any realistic difference.


Mash Tun Insulation Comparisons – Complete

It is a hard truth that you will lose some temperature during your mash.  In my desire to go electric, I recently purchased the BREWER’S EDGE® MASH & BOIL from William’s Brewing.  Without actually even having brewed a batch of beer on it yet, I already got to work figuring out how to insulate it.  I tested various insulation methods on the Mash & Boil, but the relative comparisons should be valid on any mash tun.  A post with a better review of the Mash & Boil and my reasoning for wanting to go electric will come at a later date.

Nerd Alert!

Warning, the material in this post could get a bit nerdy.

WarningSign

Difficulty: level_5

Easy for you

Time Required:

Just a read for you fortunately.  It took me about a week to perform the experiments.
Affiliate Links

Background:

One of the advantages of an electric brewing system should be accurate temperature control.  With such a new system as the BREWER’S EDGE® MASH & BOIL, there is a lot of discussion about the 6 degree swing in temperature control.  This is pretty well contrasted with much more expensive systems as the Grainfather or PicoBrew Zymatic that may hold temperature within a degree or two.
While I do agree this could and should be safely regulated to a tighter temperature band on the Mash & Boil, I would at least propose that the first line of defense is just to insulate your mash tun so that accurate temperature control is not as critical.  In all reality, this is a turn-key electric brewing system for less than 1/3 the cost of the other systems on the market.


I initially started brewing with a 44 Qt kettle doing 5 gallon batches with a propane burner.  I did notice a decent amount of temperature loss, so I created a thermal wrap to use during the mash.  This was made using some cotton based insulation meant for water heaters.  I did not want to mess with fiberglass based insulation.  When I moved to a 62 Qt kettle and larger batches, I think the larger thermal mass helped maintain temperatures better, but I went ahead and used the same wrap anyway.


With the new system, it had such a different diameter to height ratio, I decided to start from new again.  Since we homebrewers are a thrifty bunch, it usually comes down to whatever we had on hand at the time we needed to create it.  This time for me, however, I had enough time to plan it out and (gasp) actually test it before using it.  As stated before, these results should be applicable to any mash tun that adheres to the laws of thermodynamics.
These results are relevant to a mash because the only thing that will change will be the specific heat of the mixture.  So the best insulation with water will still be the best with grain in the mash.

After my first post (part I) there was some discussion online and in forums surrounding the lack of air gap between the outer layer of Reflectix and the kettle in my testing.  As an engineer, I’d like to think that my test methodology is 100% comprehensive.  Also as an engineer, I’m always willing to accept that I might be wrong and the best way to do that is to attempt to prove that I am wrong.  I then ran variations of the Reflectix configuration only and posted them in (part II).

This post is a combination of (part I) and (part II) so that one can get all the information at once.  If you wish to read them as well, go ahead, but ALL the information from both posts has been combined here.  If future testing is taken on, this post will be updated and serve as the master record.

Insulation methods to test:

Baseline – Stock BREWER’S EDGE® MASH & BOIL kettle

024-Insulation_Baseline
  1. Described as double wall stainless construction
  2. Pros: you don’t have do do anything
  3. Cons: Hypothesis is that this will be the worst performer

Duck brand, cotton enhanced (Non-fiberglass)

024-Insulation_Cotton_Based

  1. Was about $20 when I originally bought it and that is about the going rate at your local hardware store
  2. This was the insulation wrap from my 62Q Bayou Classic kettle
  3. Pros: Fairly inexpensive, relatively easy to find and no special handing required
  4. Cons: A bit dusty when cutting and not as tidy as the Reflectix

Sleeping Bag:

I wrapped the sleeping bag all the way around the kettle once and then had enough length left over to do a sort of “comb over” on the top of it.  I finished it off by holding it on with the bungee cord.
024-Insulation_Sleeping_Bag 
  1. No link, as these have been in my family for a LONG time
  2. Pros: super quick and most people have them on hand
  3. Cons: If you somehow damage it for brewing, you’ll probably get in trouble with your family

3 Layers of Reflectix

024-Insulation_Reflectix

  1. It cost me $27 for a 25 foot roll at my local hardware store and is enough for 2 kettles worth
  2. 3 layers from the lip of the kettle to the top of the control box
  3. 3 layers loosely fit on the lid
  4. Pros: Easy to work with, clean look
  5. Cons: Really requires a semi-custom fit for it to perform well
  6. I’ll have a future post with cut dimensions so you can make your own

Reflectix with 2 cm gap

  1. The Reflectix website recommends the gap to consist of 3 layers of the bubble insulation
  2. https://www.reflectixinc.com/applications/diy/water-heater/
  3. I actually created 2 rings (top and bottom) composed of 3 layers of Reflectix that were 2 cm wide
  4. Then I used the 3 layer baseline Reflectix jacket wrapped around it.

026-gap rings026-gap distance026-gap as tested

Reflectix  “Dome”

  1. Having thought of the sleeping bag winning out big time, I wondered if it was due to the superiority of the sleeping back insulation properties or the fact that with that test, the entire kettle was surrounded (top and sides) with the sleeping bag.  Whereas, with the other insulation methods, there was a gap for practicality purposes between the lid insulation and the wall insulation.  I questioned whether this open gap was allowing more heat to escape.
  2. I constructed a dome that encapsulated the entire kettle.  The diameter was about 18″ (about 2.5″ air gap to the kettle surface) and the height was 28″.

026-dome as tested

Other methods considered (since I have seen them used), but not tested

  1. Fiberglass water heater insulation (I don’t want fiberglass anywhere near my beer)
  2. Single and double layers of Reflectix to understand the impact
  3. Custom molded expanding foam mold
  4. Red-Hooded sweatshirt

Setup and Test Methodology (Identical to the last time) :

I have not modified the Mash & Boil in any way.  I just used the unit in stock condition and let the temperature controller do it’s thing to get the water up to temperature.  I used exactly 6 gallons of RO water for the experiment.
The kettle was placed in my basement storage room, which maintained a consistent 65 degF throughout the testing.
I had 3 temperature probes in the kettle.  One at 1″ from the bottom, then another 6″ up and another 12″ up.  This was a nice spread for 6 gallons of water.  In reporting temperatures in this experiment  I am only using the temperature sensor at the 6″ height.  The other sensors were a proof of concept for some future testing I plan to carry out.  I did see some stratification in the temperatures over time as the water cooled, but for consistency, I chose the 6″ probe.
To start the each test, I topped off to 6 gallons and set the Mash & Boil to 215 degF and let it ramp up.  As soon as the system was boiling, I turned it off and unplugged it from the wall.  Temperature measurements were taken approximately every minute.  I allowed the temperatures to cool to somewhere around 100 degF or as long as I could stand it.  Absolutely no stirring or opening of the lid occurred during the cool down.
The critical stage in the test was when the water cooled to 155 degF.  At that point, marker would be taken and then compared to the temperature exactly 60 minutes later.  This would be indicative of a typical mash temperature and the relative temperature loss during the mash.  Yes there will be different thermal capacities of a water/grist mix, so to reduce the experiment to just the insulation, straight RO water was used.

Results:

I normalized the cool down datasets so that the start time (t=0) was the same for each configuration at 200 degF.  As a visual reference aid, I placed a line at 155 degF to see what the curves look like near mash temperatures.


One can clearly see here that the baseline configuration with no additional insulation decreases in temperature the most rapidly.  The cotton based insulation is a bit better, then beat by the Reflectix configurations and then the sleeping bag.  You can see that the 3 Reflectix configurations are quite close to each other when compared to the rest.

027-Overall Cooling Summary

Reflectix only shown below
026-Reflectix Cooling Summary


This small table places numerical values on the temperature drops through a simulated mash temperature window.  I calculated these temperature drops by taking the very last data point that was greater than 155 degF.  Then I grabbed the next data point that was +60 minutes from that initial point.  The values shown are then the differences between those two temperatures.


027-Full Summary


To glean even more from the data, I plotted the 3 different configurations only through the mash temperature window.  I normalized these curves so that the start time (t=0) was the same for each configuration at 155 degF The left axis shows the actual temperature reading, while the right axis shows the temperature drop, relative to the 155 degF starting reference temperature.  I also placed a helper line at 155 degF.


If you are to accept the belief that most of the conversion is done within the first 15 minutes of the mash, all of the Reflectix and Sleeping Bag insulation methods show a drop of less than 1 degF within the first 15 minutes.

027-Overall Mash Summary

Reflectix only shown below

026-Reflectix Mash Summary

Discussion:

The extended time plots do show the dome to be the best, followed by the 3 full layers and lastly the 2 cm gap.
I am surprised that the recommended method from Reflectix was slightly worse than the full 3 layers.  I’ve struggled to come up with a reason, but I think it would require more thought and analysis than I feel like spending on it.


It appears that when choosing Reflectix, that you almost can’t go wrong with any of the 3 methods as far as mashing goes.  Due to the 0.2 degF difference in temperature drop between the 3 different methods during the simulated mash time, I’d almost call it a tie.  However if you want to pull other factors in, depending on your preference, I can add some additional points.

Differences in Reflectix configurations

026-Reflectix Cooling Summary
The extended time plots do show the dome to be the best, followed by the 3 full layers and lastly the 2 cm gap.
I am surprised that the recommended method from Reflectix was slightly worse than the full 3 layers. I’ve struggled to come up with a reason, but I think it would require more thought and analysis than I feel like spending on it. Precisely why I just tested and reported the results.

Conclusion:

Everyone has their own selection criteria when choosing the best equipment for their needs, so I hope you’ll find the information reported in this post useful.


It appears that when choosing Reflectix, that you almost can’t go wrong with any of the 3 methods as far as mashing goes. Due to the 0.2 degF difference in temperature drop between the 3 different methods during the simulated mash time, I’d almost call it a tie. However if you want to pull other factors in, depending on your preference, I can add some additional points.


There is something to the gap and whether it is just plain air or air encapsulated in bubble wrap, it is as effective as air naturally is.

I’m not suggesting that I do the testing, but I’d be willing to be that if you simply took a bunch of mylar balloons and created a dome as I did (or re-created the other methods), you’d get a similar result. Nothing particularly special about the materials involved, just the application.


3 Layer Reflectix:

Definitely adds the most material, but is what I had already made, so for me, that’s what I’m sticking with.  Plus I just felt that without the spacer rings, there would be less material to snag on something else.

Reflectix with 3 layer gap:

Probably the least amount of material needed and arguably the same performance as the other 2 options.

Reflectix Dome:

Also a lower amount of material, but for storage, if you want to maintain the shape, it is quite bulky.  I would caution against this method if you have electronics or moisture sensitive gauges integrated with your kettle.  When using this dome, it gets quite steamy in there and moisture could find a way into the electronics enclosure or gauge.

Mash Tun Insulation Comparisons, Part II

After my previous post Mash Tun Insulation Comparisons there was some discussion online and in forums surrounding the lack of air gap between the outer layer of Reflectix and the kettle in my testing.  As an engineer, I’d like to think that my test methodology is 100% comprehensive.  Also as an engineer, I’m always willing to accept that I might be wrong and the best way to do that is to attempt to prove that I am wrong.

Nerd Alert!

Warning, the material in this post could get a bit nerdy.

WarningSign

Difficulty: level_5

Easy for you

Time Required:

Just a read for you fortunately.  It took me about a week to perform the experiments.
Affiliate Links

Background:

As stated, this is an addendum to the previous post Mash Tun Insulation Comparisons comparing various insulation methods.

If you would like to read the comprehensive test of all insulation methods, check out this post: Mash Tun Insulation Comparisons – Complete

Additional Insulation methods to test:

Baseline – 3 Layers of Reflectix

    1. Repeat of previous data, but establishing this as the baseline
024-Insulation_Reflectix

Reflectix with 2 cm gap

  1. The Reflectix website recommends the gap to consist of 3 layers of the bubble insulation
  2. https://www.reflectixinc.com/applications/diy/water-heater/
  3. I actually created 2 rings (top and bottom) composed of 3 layers of Reflectix that were 2 cm wide
  4. Then I used the 3 layer baseline Reflectix jacket wrapped around it.

026-gap rings026-gap distance026-gap as tested

Reflectix  “Dome”

  1. Having thought of the sleeping bag winning out big time, I wondered if it was due to the superiority of the sleeping back insulation properties or the fact that with that test, the entire kettle was surrounded (top and sides) with the sleeping bag.  Whereas, with the other insulation methods, there was a gap for practicality purposes between the lid insulation and the wall insulation.  I questioned whether this open gap was allowing more heat to escape.
  2. I constructed a dome that encapsulated the entire kettle.  The diameter was about 18″ (about 2.5″ air gap to the kettle surface) and the height was 28″.

026-dome as tested

Setup and Test Methodology (Identical to the last time) :

I have not modified the Mash & Boil in any way.  I just used the unit in stock condition and let the temperature controller do it’s thing to get the water up to temperature.  I used exactly 6 gallons of RO water for the experiment.


The kettle was placed in my basement storage room, which maintained a consistent 65 degF throughout the testing.
I had 3 temperature probes in the kettle.  One at 1″ from the bottom, then another 6″ up and another 12″ up.  This was a nice spread for 6 gallons of water.  In reporting temperatures in this experiment  I am only using the temperature sensor at the 6″ height.  The other sensors were a proof of concept for some future testing I plan to carry out.  I did see some stratification in the temperatures over time as the water cooled, but for consistency, I chose the 6″ probe.


To start the each test, I topped off to 6 gallons and set the Mash & Boil to 215 degF and let it ramp up.  As soon as the system was boiling, I turned it off and unplugged it from the wall.  Temperature measurements were taken approximately every minute.  I allowed the temperatures to cool to somewhere around 100 degF or as long as I could stand it.  Absolutely no stirring or opening of the lid occurred during the cool down.


The critical stage in the test was when the water cooled to 155 degF.  At that point, marker would be taken and then compared to the temperature exactly 60 minutes later.  This would be indicative of a typical mash temperature and the relative temperature loss during the mash.  Yes there will be different thermal capacities of a water/grist mix, so to reduce the experiment to just the insulation, straight RO water was used.

Results:

I normalized the cool down datasets so that the start time (t=0) was the same for each configuration at 200 degF.  As a visual reference aid, I placed a line at 155 degF to see what the curves look like near mash temperatures.  You can see that the 3 Reflectix configurations are quite close, but the recommended gap of 3 layers (2 cm) appears to be the worst of the configurations.


026-Reflectix Cooling Summary


This small table places numerical values on the temperature drops through a simulated mash temperature window.  I calculated these temperature drops by taking the very last data point that was greater than 155 degF.  Then I grabbed the next data point that was +60 minutes from that initial point.  The values shown are then the differences between those two temperatures.

026-Reflectix Summary

To glean even more from the data, I plotted the 3 different configurations only through the mash temperature window.  I normalized these curves so that the start time (t=0) was the same for each configuration at 155 degF The left axis shows the actual temperature reading, while the right axis shows the temperature drop, relative to the 155 degF starting reference temperature.  I also placed a helper line at 155 degF.


If you are to accept the belief that most of the conversion is done within the first 15 minutes of the mash, all of the Reflectix configurations drop by less than 1 degree.


026-Reflectix Mash Summary

 Discussion:

The extended time plots do show the dome to be the best, followed by the 3 full layers and lastly the 2 cm gap.
I am surprised that the recommended method from Reflectix was slightly worse than the full 3 layers.  I’ve struggled to come up with a reason, but I think it would require more thought and analysis than I feel like spending on it.


It appears that when choosing Reflectix, that you almost can’t go wrong with any of the 3 methods as far as mashing goes.  Due to the 0.2 degF difference in temperature drop between the 3 different methods during the simulated mash time, I’d almost call it a tie.  However if you want to pull other factors in, depending on your preference, I can add some additional points.

3 Layer Reflectix:

Definitely adds the most material, but is what I had already made, so for me, that’s what I’m sticking with.  Plus I just felt that without the spacer rings, there would be less material to snag on something else.

Reflectix with 3 layer gap:

Probably the least amount of material needed and arguably the same performance as the other 2 options.

Reflectix Dome:

Also a lower amount of material, but for storage, if you want to maintain the shape, it is quite bulky.  I would caution against this method if you have electronics or moisture sensitive gauges integrated with your kettle.  When using this dome, it gets quite steamy in there and moisture could find a way into the electronics enclosure or gauge.